This document was added or updated on 02/06/2020.
INTERNATIONAL COMPARISONS OF LABOUR FORCE STATISTICS
International comparisons of labour statistics are essential in providing a global context to economic analysis, social research and policy formation and evaluation.
When comparing data across countries, consideration must be given to the differences in how labour concepts are measured. Since 1919, the International Labour Organisation (ILO) has maintained and developed a system of international labour standards. The ABS provides data about the Australian labour for to groups such as the Organisation for Economic Co-operation and Development (OECD) and ILO, who collate data from multiple countries on a similar basis to allow such cross-country comparisons to occur.
This fact sheet will:
- provide a brief comparison of the labour markets of five countries using data from the ILO; and
- compare and contrast the methodology of the key labour force survey of each country.
To determine how labour force trends in Australia compare with those elsewhere, Australia is often compared to Canada, New Zealand, United Kingdom and United States of America.
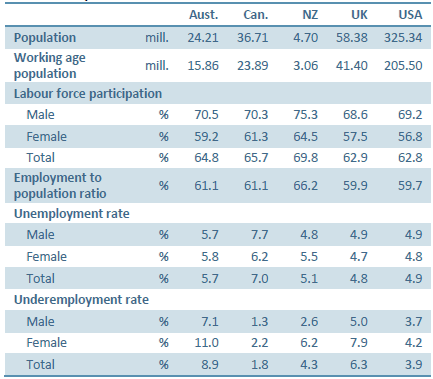
Table 1: Key Labour Force Statistics, 2016
 Source: ILOSTAT Database
CROSS-COUNTRY DATA COMPARISON
Key Labour Statistics: 2016
Table 1 shows the key labour force figures for the five countries for 2016, disaggregated by sex.
New Zealand had the highest participation rate overall, at 69.8%, with the participation rate for both men and women being considerably higher than the other countries shown. The participation rate for the UK and USA were below that of other countries, however, their unemployment rates were also lower.
While Canada had a slightly higher labour force participation rate than Australia, its unemployment rate was higher, with the two countries having the same employment to population ratio of 61.1%.
For all countries shown, the underemployment rate was higher for women than for men; however, the same story was not true for the unemployment rate. Women in Canada and the UK had a lower unemployment rate than their male counterparts, with the gap between Canadian men and women being as large as 1.5 percentage points.
Time-series data: Unemployment and Underemployment
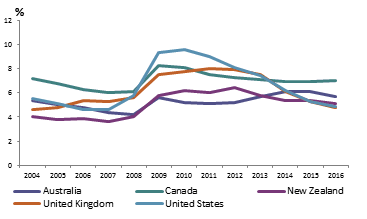
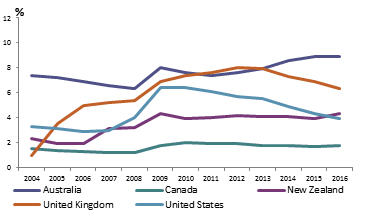
Figure 1 and Figure 2 show the change in the average annual unemployment and underemployment rate for the five countries from 2004 to 2016. In particular, this period shows the impact of the Global Financial Crisis (GFC) on each country’s labour force.
The GFC had the greatest impact on the unemployment rate of the United States (increasing from 4.4% in 2007 to 9.6% in 2010), followed by the United Kingdom (increasing from 5.3% in 2007 to 8.0% in 2011). However, the unemployment and under-employment rates for both countries have been decreasing over recent years.
While Australia had the lowest unemployment rate of the five countries in the years after the GFC, it also had one of the highest rates of underemployment, which continued to grow from 2011 onwards.
These cross-country comparisons highlight the features of the Australian labour market that are unique, and those that are in line with global trends. Such analysis is crucial in evaluating and formulating policy.
Figure 1: Unemployment Rate, 2004 to 2016
 Source: ILOSTAT Database
Figure 2: Underemployment Rate, 2004 to 2016
 Source: ILOSTAT Database
COMPARISONS OF DATA COLLECTIONS
When comparing data across countries, consideration should also be given to differences in the collection methodologies of each country’s labour force survey. Table 2 summarises the key features of each survey.
Table 2: Comparison of data collections
 | Australia
| Canada
| New Zealand
| United Kingdom
| United States
|
| Survey | Labour Force Survey | Labour Force Survey | Household Labour Force Survey | Labour Force Survey | Current Population Survey |
| Organisation | Australian Bureau of Statistics | Statistics Canada | Statistics New Zealand | Office for National Statistics | Bureau of Labour Statistics |
| Frequency | Monthly | Monthly | Quarterly | Quarterly | Monthly |
| Scope | Usually resident, civilians aged 15+ | Civilian non-institutionalised population aged 15+ | Usually resident, civilian non-institutional populations aged 15+ | Permanent residents aged 16-74 years | Usually resident, civilian non-institutional populations aged 16+ |
| Sample Size | Approx. 26 000 dwellings
(52 000 persons) | Approx. 56 000 dwellings
(100 000 persons) | Approx. 15 000 dwellings
(30 000 persons) | Approx. 40 000 dwellings
(100 000 persons) | Approx. 60 000 dwellings
(112 000 persons) |
Population
(June, 2016) | 24.21 mill. | 36.71 mill. | 4.70 mill. | 58.38 mill. | 325.34 mill. |
| % population in survey | 0.21% | 0.27% | 0.64% | 0.17% | 0.03% |
Working age population
(2016) | 0.33% | 0.42% | 0.98% | 0.24% | 0.05% |
| Sample rotation | Rotating panel sample design. Selected households remain in the survey for eight consecutive months. A new rotation group is introduced each month to replace an outgoing group (one-eighth of the sample). | Rotating panel sample design. Selected households remain in the survey for six consecutive months. A new rotation group is introduced each month to replace an outgoing group (one-sixth of the sample). | Rotating panel sample design. Selected households remain in the survey for eight consecutive quarters. A new rotation group is introduced each quarter, from the same Primary Sampling Unit, to replace an outgoing group (one-eighth of the sample). | Rotating panel sample design. Selected households respondents are questioned five times at 13 week intervals (consecutive) and one-fifth of the sample is replaced each quarter. | Eight representative rotation groups, each in the sample for eight months total. Each rotation group is included in the sample for two four month periods, separated by an eight month period not in the sample. 75% of the sample is common from month-to-month and 50% one year apart for the same month. |
| Collection methodology | Personal interview, telephone interview, and online form. Data is collected for each in-scope household member from 'Any Responsible Adult'. | Personal or telephone interview (in English or French). Data collected from a knowledgeable household respondent. Proxy reporting accounts for 65% of collected information. | First interview conducted in person with subsequent interviews via telephone, unless personal interview requested by respondent. | First interview conducted in person, with subsequent interviews via telephone. 35.0% of the interviews in 2015 were carried out by proxy. | Personal interview conducted in first and fifth month (after 8 month dormant period). Other interviews via telephone. Data collected from a responsible adult household respondent. |
| Response rates | Approx. 93% | Approx. 90% | Approx. 78% | Approx. 49% | Approx. 87% |
| Topics | Employment, unemployment, underemployment, labour underutilisation, participation, working time, job search, last job and economic inactivity by socio-demographic groups and by region. | Employment, unemployment, underemployment, labour underutilisation, working time, weekly earnings and economic inactivity by socio-demographic groups and by Provinces. | Employment, unemployment, underemployment, labour underutilisation, working time and economic inactivity by socio-demographic groups and by region. | Employment, unemployment, underemployment, labour underutilisation and economic inactivity by socio-demographic groups. | Employment, unemployment, underemployment, labour underutilisation, working time and economic inactivity by socio-demographic groups and by States. |
For more information
To provide feedback on this Labour Statistics Fact Sheet please email:
labour.statistics@abs.gov.au
 Print Page
 Print All